Exploring the Reissner-Nordström Metric: A Journey into Gravitational and Electromagnetic Fields
The chosen metric for this project, as mentioned previously is the Reissner-Nordström metric. In this post I will explain the code that makes up my contribution, which involves exploring the metric, its components and visualising the results using an example python notebook to address the issue I have assigned myself to.
Setting Up the Exploration
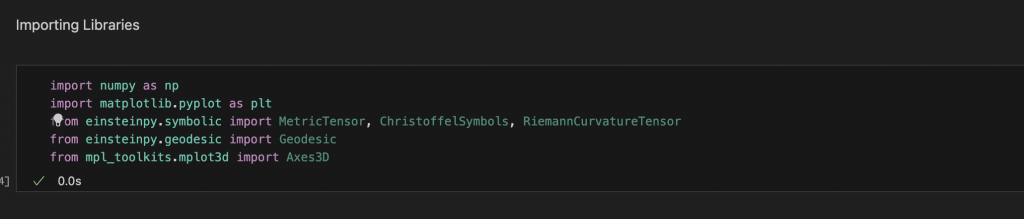
To begin this example notebook I imported the necessary libraries for the contribution: numpy for numerical formulas and calculations, matplotlib for visualisation and einsteinPy for symbolic calculations.
Defining the Metric Function
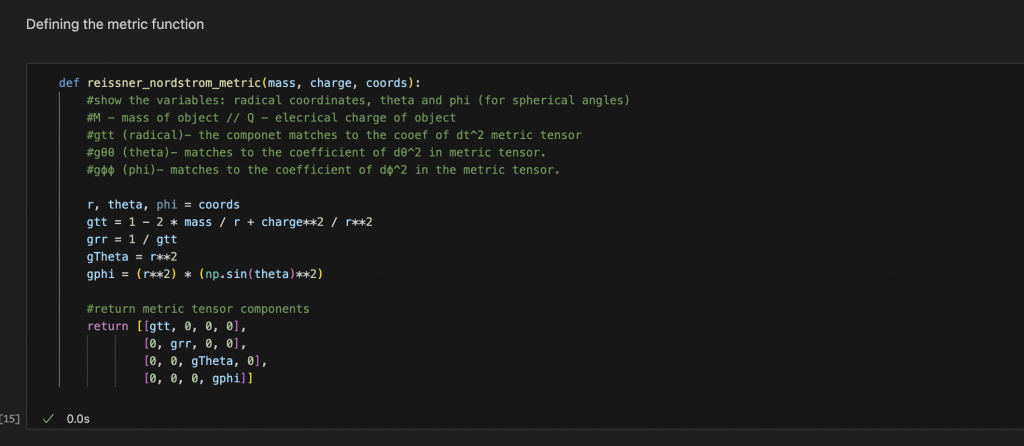
Here I begin to define the `reissner_nordstrom_metric` function, which I incorporate necessary variables, such as mass (M) and electrical charge (Q) of the object. These variables are essential when it comes to shaping the curvature involved in spacetime.
I then proceeded to define the metric tensor components:
M – mass of object,
Q – electrical charge of object,
gtt (radical)- the component matches to the cooefficient of dt^2 metric tensor,
gθθ (theta)- matches to the coefficient of dθ^2 in metric tensor,
gϕϕ (phi)- matches to the coefficient of dϕ^2 in the metric tensor.
Computing Metric Components
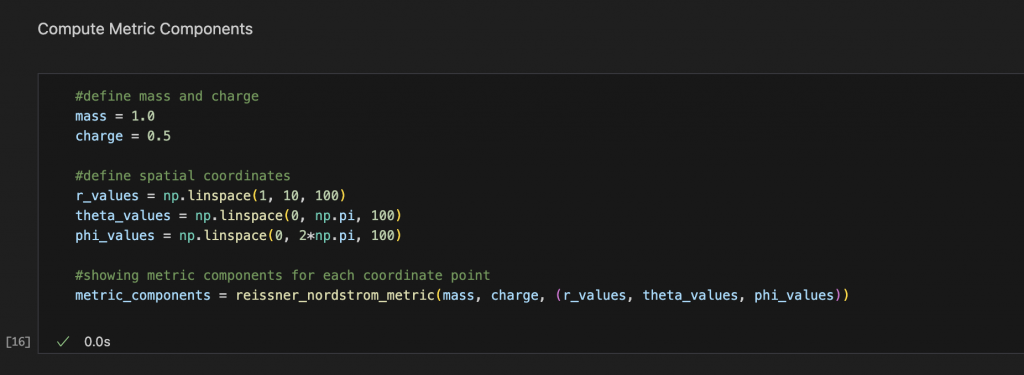
After the function has been defines, I call the function passing in values for mass (M) and charge (Q), and the spatial coordinates: r, theta and phi values. I utilised bumpy arrays to generate the range of each coordinate, before passing them into the function to find the metric tensor components.
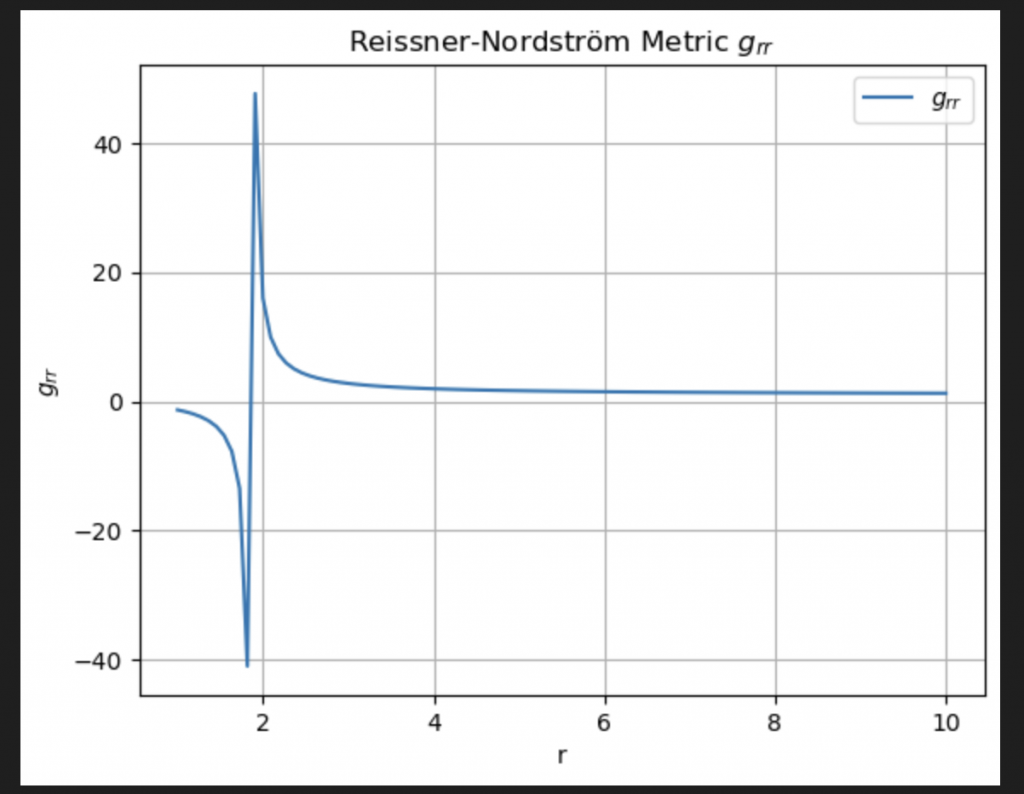
Visualising the Metric
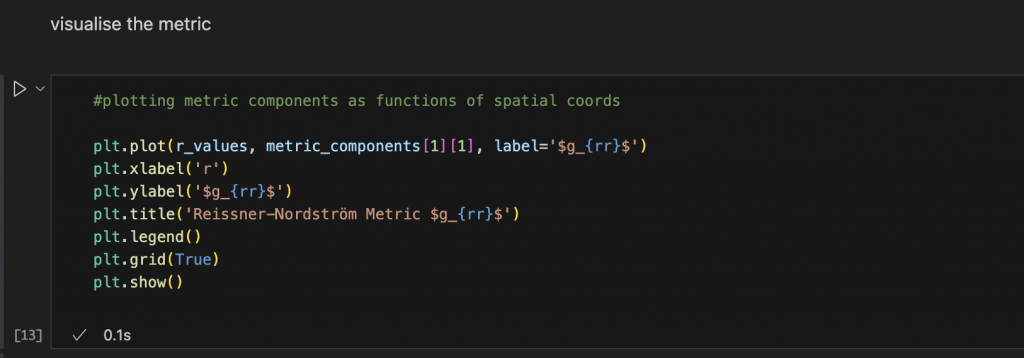
In order to see the curvature of the spacetime using the Reissner-Nordström metric, visualisation is useful. I use matplotlib to achieve this, first by covering the ex-axis, y-axis by plotting the metric component grr as a function of the radical coordinate.
To show the visualisation as an output in the notebook I use plt.show(). The visualisation shown in this post demonstrates the gravitational field surrounding the charged object, highlighting the curve shape.
In conclusion, exploring the Reissner-Nordström metric in this open source contribution has helped me understand not only more on electromagnetic fields through charged mass objects, but incorporating this type of maths into code, and using libraries such as matplotlib to visualise this.